Coffee is Better with Statistics
When my 30-year-old coffeemaker joined the great coffeehouse in the sky, I decided to try making pour-over coffee instead of buying a new machine. The touted advantages include reclaimed counter space, simplicity, and better taste. You just pour boiling water over ground coffee nestled in a filter.
So I found instructions on the internet and tried a cup. It was simple to make, but the coffee tasted like a crayon dipped in hot water. I tried adding milk. It now tasted like a crayon dipped in hot water with milk added.
Time to use my one superpower, the knowledge of how to design an experiment. I first ran a screening experiment to narrow down the number of factors that might affect the taste. The screening experiment (I’ll write about that experiment later, since it’s more complicated than this one) told me that I should be using a fine grind, and that it made no difference whether I used medium or dark roast.
I ended up with three factors to study in this experiment:
Amount of coffee (3 tablespoons or 4 tablespoons). I would expect more coffee to result in a stronger brew.
Amount of water (10 ounces or 14 ounces). I would expect the brew strength to depend on both the amount of coffee and the amount of water.
Method of pouring (steady stream or batches). For steady stream I trickle the water continuously into the funnel so that there is always a little water on top of the coffee grounds. For batches I pour water to a height of 2 cm above the coffee, let the coffee drip out, then pour again to a height of 2 cm, and repeat until all the water has dripped through.
I can study all combinations of these three factors with eight cups of coffee. But the factors have to be assigned carefully to the different cups. I would not, for example, want to make the first four cups with 3 tablespoons of coffee and steady stream, and the second four cups with 4 tablespoons of coffee and batches. If the second four cups tasted better, on average, than the first four cups, I wouldn’t know whether they tasted better because of the amount of coffee or because of the pouring method — or because my coffeemaking skills improved during the experiment.
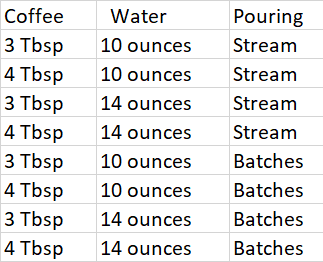
Table 1. Design in “standard” order.
Step 1. Write down the factors and settings using the pattern in Table 1. I’ll randomize the order in which the eight coffees are made later, but it’s easier to see the design in the “standard” order.
Every possible combination of the factor levels is run. This allows me to see how they work in combination. For example, if the coffee-to-water ratio affects the taste (as I expect it would), cups with little coffee and lots of water, and cups with lots of coffee and little water might both taste bad. This experiment helps me find the settings that produce good coffee much faster than if I first ran an experiment to find the optimal amount of coffee (holding everything else constant), then ran another experiment with that amount of coffee to find the optimal amount of water, and so on. The vary-one-factor-at-a-time experiments might never lead me toward the best coffee I can make, because the optimal coffee-to-water ratio might be different when I make a small cup than when I make a large cup.
Step 2. Randomize the order in which the cups are made and run the experiment. I used the random number generator in a spreadsheet program to list the 8 cups in random order; you could also draw numbers out of a hat.
I tried to hold everything else constant while running the experiment. I used an electric teakettle to have the water at approximately the same temperature for each cup; used the same type of filter, funnel, coffee, and grind; and made all cups of coffee on the same Saturday morning. I ate two tablespoons of oatmeal between cups to cleanse the palette.
I rated each cup with three numerical scores:

Materials used for coffee experiment
Taste, black. Scale from 1 (yecch) to 10 (perfect coffee enjoyment), with coffee from my previous coffeemaker rated as 5.
Taste, with milk added. After tasting the black coffee, I added hot milk until the coffee was almond color. Again scored from 1 to 10.
Strength, from 1 (weakest) to 10 (strongest)
Table 2, at the bottom of this column, contains the randomized ordering and results.
Step 3. Display the data on a cubeplot. There are three factors and eight cups of coffee, so each data point can be written at the corner of a cube. The faces on the left and right show the results for 4 Tbsp and 3 Tbsp of coffee, respectively; the faces at the bottom and top show 10 ounces and 14 ounces of water; the front and back faces show pouring by batches and pouring in a steady stream.
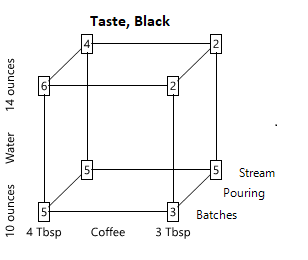

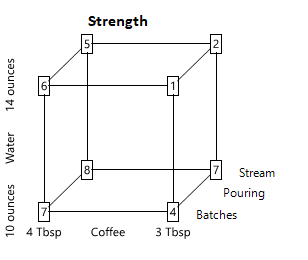
The beauty of this experimental design is that you don’t even have to do any calculations to see the results: you can just look at the cubeplots. The best-tasting cups of coffee with milk used 4 Tbsp of coffee with pouring by batches, and these had scores of 7 and 8. These were also among the best-tasting cups when drunk black, and were relatively strong.
After this simple experiment, I now regularly enjoy pour-over coffee that tastes better (to me) than the coffee I had been making with the machine. I’m happy with the pour-over coffee I make now, but every process can be improved and I plan to continue experimenting. I still haven’t answered the question foremost in the minds of those who study the history of statistics: Is it better to add milk to the brewed coffee, or to drip the coffee into a mug containing hot milk?
Copyright (c) 2019 Sharon L. Lohr
Results of Experiment

Table 2. Results from the coffee experiment. These are listed in the randomized order in which the experiment was run.