Taking an Antibody Test? Some Statistical Concepts to Keep in Mind
Each year during the early 1940s, more than 40 out of every 100,000 people in the United States died from a highly contagious disease that spread via respiratory droplets and ravaged the lungs. Tuberculosis was the seventh leading cause of death in the United States in the early 1940s (during the first decade of the 20th century it had been the number one cause of death), and one of the most feared.*
Accurate diagnosis of tuberculosis was a big concern. At the time, many in the medical community thought that physicians could infallibly diagnose tuberculosis from chest X-rays, but Jacob Yerushalmy, the chief statistician at the United States Public Health Service Tuberculosis Control Bureau, was skeptical of this claim. He thought that it was inevitable that there would be some misdiagnoses. Different physicians would disagree about whether a particular X-ray indicated tuberculosis, and in fact Yerushalmy knew of cases in which a physician would diagnose a patient as not having tuberculosis and then later, the same physician using the same X-ray would diagnose that patient as having tuberculosis.
In 1947, Yerushalmy published a paper comparing the accuracy of four X-ray techniques for diagnosing tuberculosis. He was unable to conclude that any of the X-ray techniques was superior to the others, but along the way he introduced the framework still used to describe errors for diagnostic tests. Yerushalmy wrote that “even with the best techniques it is not always possible to raise the level of diagnosis to absolute certainty in all cases of a certain disease” and argued that diagnostic tests should be evaluated using two probabilities:
“1. A measure of sensitivity or the probability of correct diagnosis of ‘positive’ cases, and
2. A measure of specificity or the probability of correct diagnosis of ‘negative’ cases.”
If you’re concerned about COVID-19, you’ve probably been reading a lot about antibody (serology) tests. You may even have taken one yourself. The Atlantic, CNN and USA Today have provided informative descriptions of what antibodies are and how antibody tests work. All these articles emphasize, though, that having a positive antibody test doesn’t necessarily mean that you possess antibodies to the virus that causes COVID-19. In this post, I:
Explore the concepts of sensitivity and specificity.
Show how to use information on sensitivity, specificity, and infection rate to estimate the probability that someone with a positive test actually has antibodies.
Tell where you can find estimates for the sensitivity and specificity of different antibody tests that are being used.
Sensitivity and Specificity, and How to Remember Which is Which
The statistical issues I’m discussing apply to any kind of test, not just to tests about the virus causing COVID-19, so let’s consider a condition called X. Some people in the population have X, and the remaining people do not have X. There’s a test for X, where some people will test positive (the test says they have X) and others will test negative (the test says they don’t have X). But the test is not completely accurate: some of the people who have X test negative (this is called a false negative), and some of the people who don’t have X test positive (this is called a false positive).
Using Yerushalmy’s framework, the test is sensitive if it is highly likely to detect X when X is actually present. That is, when a person has X, the test is usually positive; it has a low false negative rate. The sensitivity is the percentage of persons with X who test positive for it, and equals 100% minus the false negative rate.
The test is specific if it is highly likely to be negative when X is actually absent. That is, when a person doesn’t have X, the test is usually negative; it has a low false positive rate. The specificity is the percentage of persons without X who test negative for it, and equals 100% minus the false positive rate.
It’s easy to confuse the terms sensitivity and specificity,** but there are tricks for remembering which is which. You may have learned in grade school how to remember the difference between stalagmites and stalactites using the sixth letter of each word: StalaGmites grow from the Ground, and StalaCtites grow from the Ceiling. I use a similar mnemonic for sensitivity and specificity:
SeNsitivity = 100% minus False Negative Rate.
SPecificity = 100% minus False Positive Rate.
Or, if that mnemonic doesn’t work for you, it might help to think of the following image. A sensitive husband wishes you Happy Birthday on your birthday — when it’s your birthday (here, having a birthday is X), he remembers it. A husband who wishes you Happy Birthday on your birthday but on no other day is both sensitive and specific — he correctly classifies your birthday, and correctly classifies each other day as not being your birthday. A husband who wishes you Happy Birthday each day of your birth month because he can’t remember the exact day is still sensitive (after all, he does wish you Happy Birthday on the actual birthday) but not specific about which day it is (most of the days in the month are not your birthday, but he wishes you Happy Birthday anyway). A husband who wishes you Happy Birthday every day during the wrong month is neither sensitive nor specific.
Exploring Sensitivity and Specificity in Tables
The information published about diagnostic tests usually gives estimates of the sensitivity and specificity of those tests, but if you are taking a test to find out whether you have X, those aren’t the primary probabilities that you are interested in. What you really want to know is: what is the probability that I have X if I test positive for it, or what is the probability I don’t have X if I test negative for it? To calculate those probabilities, you need an additional piece of information: what percentage of persons in the population actually have X. Then you can construct a table that allows you to calculate the probability that you actually have X if you test positive for it, and the probability that you don’t have X if you test negative for it.
Let’s consider a population of size 100,000 where we know that (1) 20% of the population members actually have X, (2) the specificity of the test is 99% (i.e., false positive rate is 1%), and (3) the sensitivity of the test is 98% (i.e., false negative rate is 2%). Of course, in real life we usually don’t know these percentages for the whole population, but we can estimate them from data or explore what happens under different scenarios.
Figure 1 shows the steps for filling in a table for this hypothetical population that tells how many people in the population have X and test positive, have X and test negative, don’t have X and test positive, and don’t have X and test negative.

Figure 1. Steps for filling in a population table for a diagnostic test.
Step 1. 20% of the population actually have X. Put the number of people in the population with X, and without X, in the “Total” column.
Step 2. The false positive rate is 1% (equivalently, the specificity is 99%). This means that of the 80,000 persons who don’t have X, 1% of them (800) test positive and 99% of them (79,200) test negative. So there are 800 people in the population who don’t have X and test positive, and there are 79,200 people who don’t have X and test negative. Place these numbers in the “Test Positive” and “Test Negative” columns of the “Don’t Have X” row.
Step 3. The false negative rate is 2% (equivalently, the sensitivity is 98%). This means that of the 20,000 persons who have X, 2% of them (400) test negative and 98% of them (19,600) test positive. Place these numbers in the “Test Negative” and “Test Positive” columns of the “Have X” row. Now sum the numbers in each column to get the total number of people in the population who would test negative (79,600) and positive (20,400).
Step 4. Now that the table is complete, you can compute the probability that you have X if you test positive for it. This is called the positive predictive value, and it depends on the assumed prevalence of X in the population (here assumed to be 20%). If you test positive for X, the probability that you actually have X is 19,600/20,400 = 0.96. So if you test positive there’s a 96% chance you actually have X.
If you test negative for X, there’s still a chance that you actually have X because the test results are not perfect, but for this scenario the probability is much lower: 400/79,600 = 0.005. So if you’re one of the people who test negative for X in this population, there’s less than a 1% chance that you actually have X. Or, you can think of this in terms of the negative predictive value, the probability that you don’t actually have X if you test negative for it, which in this case is 79,200/79,600 = 0.995, or 99.5%.
The probabilities calculated in Step 4 depend on what percentage of people in the population have X. Since this percentage is unknown, it’s helpful to explore what happens under different values. Figure 2 shows eight scenarios for different combinations of (1) percent of population that actually has X (20% or 1%), (2) false positive rate of test (1% or 5%), and (3) false negative rate of test (1% or 5%).

Figure 2. Population tables under different scenarios for (1) assumed infection rate (20% or 1%), (2) false positive rate (1% or 5%), and (3) false negative rate (1% or 5%).
Look at the top right table in Figure 2. The false positive and false negative rates are both 1% (often considered relatively low error rates), which means that 99% of the people who don’t have X are expected to test negative, and 99% of the people who do have X are expected to test positive. But for this table, only 1% of the population has X. With this low incidence in the population, only half (990/1,980) of the people who test positive actually have X. This occurs because there are so many more people in this population who don’t have X than who do have X: even though the false positive and false negative rates are the same, the false positive rate is applied to a much larger set of people.
And the accuracy gets worse as the false positive rate gets higher. Look at the table in the third row and second column, with false negative rate 1% and 1% of the population having X, just as in the previous paragraph. But now, with the false positive rate being 5% rather than 1%, only 16% of the people who test positive for X actually have X! The majority of people who test positive for X, when X is uncommon in the population, actually don’t have it.
Where to Find Information on the Accuracy of a Coronavirus Antibody Test
Now that you know how to evaluate the accuracy of a diagnostic test, where can you find information about a particular test for SARS-CoV-2, the virus causing COVID-19? As of May 13, about 38,000 antibody (serology) tests for SARS-CoV-2 have been performed in Arizona, with 3.2% of those tests reporting a positive result. These blood tests don’t tell you whether you currently have the disease; they test for antibodies, not the virus itself, and you might have the virus but not yet have produced antibodies. Note that it’s also currently unknown whether possessing antibodies means one has immunity for COVID-19.
The Arizona results are from different labs, using different tests, and these tests have different sensitivities and specificities. To learn about the accuracy of a particular test, visit the Food and Drug Administration’s FAQs on Testing for SARS-CoV-2. You’ll see a list of tests that have been approved by the FDA for Emergency Use Authorization. For each test, links are given to a fact sheet for health care providers, a fact sheet for recipients, and Instructions for Use. The Instructions for Use (if available) usually give the estimated sensitivity and specificity of each test. Sometimes these statistics can be found instead in an Emergency Use Authorization Summary.
The FDA also has a web page summarizing the estimated sensitivity and specificity for the different antibody tests that have been approved for emergency use. One test lists sensitivity 93.8% and specificity 96%; another lists sensitivity 90% and specificity 100%; another lists sensitivity 100% and specificity 99.8%.***
But wait. There’s one more thing to check. These are all estimates of the sensitivity and specificity of a test. The numbers for sensitivity and specificity aren’t delivered by an omniscient being; they come from applying the test to blood samples from a set of persons known to have had the virus, and to another set of blood samples from a set of persons known to be unexposed to the virus.
You want to look at how many samples were used to estimate the sensitivity and specificity. After all, a lab could perform the test on one sample from a person who has had the virus and then, if the test comes up positive, claim that the estimated sensitivity is 100%. But that’s not a reliable estimate of the sensitivity because it’s based on only one sample. Maybe if they had tested two samples from persons who had the virus instead of just one, the estimated sensitivity would have been 50%. So you want to see how many positive samples and negative samples were tested for calculating the estimates of sensitivity and specificity. Generally, the larger the number of samples, the more reliable the estimates are. It’s also desirable to have the samples that are tested come from a diverse set of people who have, and haven’t, had the virus (ideally, these would be representative samples from the respective populations). If all of the positive blood samples came from people in the same family, for example, there might be some other factor unique to that family that causes the test to be more or less accurate than it would be on persons outside of that family.
Let’s look at the statistics for the “Wadsworth New York SARS-CoV Microsphere Immunoassay for Antibody Detection,” which are given on the FDA web page. You can find details about the origins of the blood samples tested in the Emergency Use Authorization Summary for the test.
The estimated sensitivity comes from 108 samples collected at least 25 days after onset of symptoms from persons in Westchester County confirmed to have had COVID-19 by a PCR test (that’s the test used to diagnose whether someone is currently infected with the virus, typically performed on a sample of mucus collected by a swab from the nose or throat). Of those, 95 tested positive, and 13 tested negative or were indeterminate. This gives an estimated sensitivity of 95/108, or 88%. This estimate is from a sample, though, so the researchers also give a 95% confidence interval for the sensitivity ranging from 80.49% to 92.83%.
To estimate specificity, the researchers gathered 433 serum samples from persons presumed uninfected by the virus (256 of these were from persons who had donated blood in 2009, long before the virus was found in humans). Of these, 428 tested negative and 5 tested positive, giving an estimated specificity of 98.8% (with 95% confidence interval ranging from 97.3% to 99.5%).
Now we can construct estimates of population tables for different assumed levels of disease prevalence in the population. Figure 3 shows a table constructed using these estimates for sensitivity and specificity under the assumption that 5% of the population actually has antibodies to the virus. I used a population of size 100,000, but the positive predictive value (the estimated percentage of the people testing positive who actually have antibodies) will be the same for any population size you use.
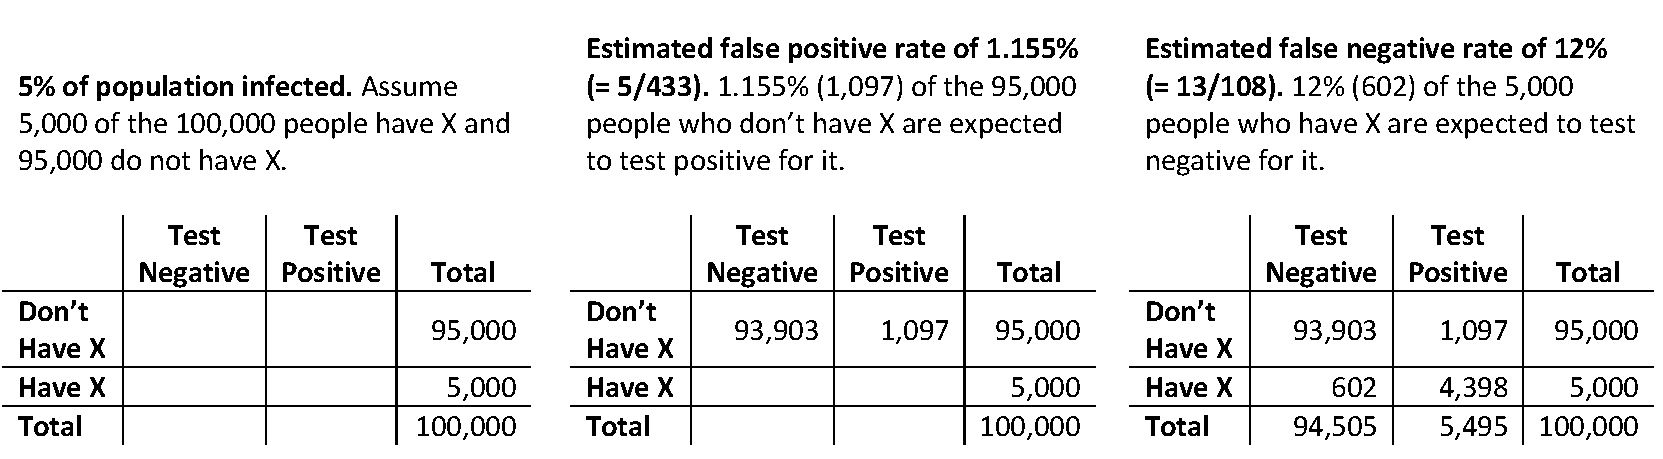
Figure 3. Estimated population table when 5,000 of the 100,000 people actually have antibodies.
From Figure 3, we can estimate that 80% (= 4,398/5,495) of the people testing positive for the virus will actually have antibodies to it. We can use statistical software**** to obtain a 95% confidence interval for this percentage: this interval ranges from 62.9% to 90.5%.
Copyright (c) 2020 Sharon L. Lohr
References
Lilienfeld, David E. (2007). Abe and Yak: The Interactions of Abraham M. Lilienfeld and Jacob Yerushalmy in the Development of Modern Epidemiology (1945-1973). Epidemiology, 18 (4), 507-514.
Yerushalmy, Jacob (1947). Statistical Problems in Assessing Methods of Medical Diagnosis, with Special Reference to X-ray Techniques. Public Health Reports, 62 (40), 1432-1449.
Footnotes
*Each year between 1900 and 1909, tuberculosis was either the leading cause of death or the second leading cause of death in the United States, according to the statistics kept at the time. Each year during that period, between 175 and 200 persons per 100,000 population died from tuberculosis.
Some areas of the country had even higher death rates. Arizona, with its dry hot climate and open spaces, was home to a number of tuberculosis sanitariums, including the Arizona State Tuberculosis Sanitarium that opened in Tempe in 1934. The tuberculosis death rate in Maricopa County (home of Phoenix and Tempe) was about three to six times as high as the national tuberculosis death rate for each year between 1900 and 1940.
Tuberculosis still is a fearsome disease. According to the World Health Organization, tuberculosis remains one of the ten leading causes of death worldwide, killing 1.5 million people around the world in 2018.
**I prefer to avoid this confusion by instead using the self-descriptive terms false positive rate and false negative rate, but if you read the medical descriptions of the antibody tests you’ll encounter the terms sensitivity and specificity, so you need to know what they are. These concepts are not limited to medical testing; they apply to any situation in which units are classified into two categories but there may be errors in the classification. My very first blog post discussed a situation in which the majority of schools listed as having a school shooting actually did not have one. The likely reason for the error was false positives that may have occurred when schools filled out the 79-page questionnaire and checked the wrong box on the question about school shootings.
***You can sometimes find estimates of sensitivity and specificity for tests not in the FDA’s list by performing an internet search for “sensitivity” or “specificity” along with the name of the test. Estimated sensitivities and specificities for some of tests have been less than 85%. In some cases, independent researchers have performed an independent assessment of available tests, as in this preprint by researchers from the University of California, San Francisco. In general, the more laboratories that have verified the properties of a diagnostic test, the better.
****The confidence intervals are calculated using the Wilson method (some labs use confidence intervals calculated by the Clopper-Pearson method, which is similar; both methods work by inverting a hypothesis test so that the confidence limits are always between 0% and 100%). These methods assume that all the blood samples used to estimate the specificity or sensitivity are independent. If multiple samples in the data come from the same person, that might induce dependence among the data and in that case the confidence intervals should be wider than the ones reported here.
One method for calculating confidence intervals for the positive and negative predictive probabilities is to assign survey weights to the observations in the samples used to estimate sensitivity and specificity so that the weights sum to the assumed population numbers who do, and don’t, have X. This method assumes that the persons in the two samples are simple random samples of the people with, and without, the antibodies in the population of interest. That is a strong assumption, since often these are convenience samples. This is another reason to have multiple laboratories assess the sensitivity and specificity of a proposed diagnostic test: different labs will conduct the assessments on samples from different sets of people, which gives one more confidence in the results.