Crime Statistics in the Time of COVID-19
One of my favorite xkcd.com comics shows the form of “Every Data Table from Now On” (Figure 1).
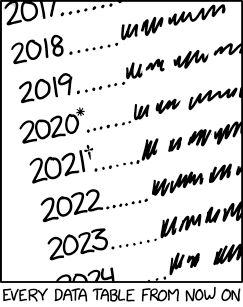
Figure 1. Every Data Table From Now On, from https://xkcd.com/2502/
The COVID-19 pandemic disrupted data collections around the world, and the comic perfectly captures the idea that almost every statistic published from data collected in 2020 or 2021 will need a footnote explaining how it may need to be interpreted differently than statistics for other years.
In this column, let’s look at some of the “footnotes” for interpreting 2020 crime statistics from the two major national sources of data about crime in the United States, supplementing the general guidelines for interpreting crime statistics given in my book Measuring Crime: Behind the Statistics. I discuss the effect of the COVID-19 pandemic* on the data collection and the interpretation of statistics, not the effect on the amount of crime. Other authors (see the article by Pew Research and other articles listed in the references) have provided comprehensive discussions of changes in homicide rates for 2020; here, I focus on violent crimes other than homicide.
Police Statistics from the FBI Uniform Crime Reports
The Federal Bureau of Investigation posted the 2020 statistics from the Uniform Crime Reporting System in September, 2021. Throughout 2020, law enforcement agencies continued to collect data on crimes known to and recorded by the police, and to forward these to the FBI.
The main FBI Crime Data Explorer web page shows two types of statistics, and the statistics that come from the Summary Reporting System (SRS) need to be interpreted differently than those from the National Incident Based Reporting System (NIBRS). The FBI has been encouraging law enforcement agencies to transition from the SRS, which was established in 1929 and collects only counts of crimes, to NIBRS, which collects counts as well as detailed information on individual crime incidents, since the 1990s; statistics from 2021 and subsequent years will be based entirely on NIBRS statistics. In 2020, about half of law-enforcement agencies (representing about 53 percent of the population) reported statistics through NIBRS; most of the other agencies reported through SRS. For 2020 and previous-year statistics, data from NIBRS-reporting agencies were converted to SRS format and merged with the data from agencies that reported via SRS. Thus, the SRS statistics for 2020 apply to the United States as a whole, while the NIBRS statistics apply only to the set of law-enforcement agencies that submitted their data through NIBRS.**
Figure 2 reproduces the Crime Data Explorer graph “Trends of Violent Crime from 2010 to 2020.” This graph is computed from the statistics from all law-enforcement agencies that submit data to the FBI (including both the SRS- and NIBRS-reporting agencies) and thus can be interpreted as applying to the nation as a whole.

Figure 2. Trends in violent crime, from https://crime-data-explorer.app.cloud.gov/pages/explorer/crime/crime-trend. This graph shows the number of offenses per 100,000 population for each year from 2010 to 2020, based on SRS data reported to the FBI by law enforcement agencies. The crimes included in this graph are homicide, aggravated assault, rape, and robbery. The SRS statistics can be downloaded from https://crime-data-explorer.app.cloud.gov/pages/downloads.
Did violent crime go up in 2020? We can’t tell from Figure 2. The FBI statistics record crimes that are reported to the police and forwarded by law-enforcement agencies to the Uniform Crime Reporting System. Typically, only a fraction of violent crimes are reported to the police. Thus, the small increase from 2019 to 2020 could have occurred because violent crime increased. Or it could have occurred because the percentage of violent crimes reported to the police increased from 2019 to 2020. Or it could have occurred because violent crime shifted from types that are typically less reported to the police to those that are more commonly reported. Or it could have occurred if law enforcement agencies had different procedures for responding to calls, investigating crimes, and reporting statistics in 2020 than in 2019. Or the change could have been an example of the year-to-year variation that would be expected even if the overall crime rate remained the same. One needs to take a deeper dive into the data, and look at other data sources, to obtain a better picture.
National Crime Victimization Survey
Now let’s look at the other major national source of information on crime: the National Crime Victimization Survey (NCVS). The NCVS measures crime through asking persons in a large nationally representative survey sample about their experiences with crime. The crime definitions and populations studied differ somewhat for the NCVS and the FBI data; to make the statistics as comparable as possible I restrict the NCVS statistics in Figure 3 to “serious violent crime,” including rape and sexual assault, robbery, and aggravated assault (an assault involving a weapon or causing serious injury) but excluding simple assault (an assault that is not aggravated). This set of crimes approximately corresponds to the violent crimes (subtracting homicide) in the FBI statistics.
Figure 3 shows three violent crime rates from 1993 (when the current NCVS survey instrument was adopted) to 2020. The red line shows the FBI statistics for number of violent crimes (subtracting homicide) per 1,000 population, and has approximately the same pattern for 2010-2020 as the graph in Figure 2 (the line appears flatter in Figure 3 because of the larger vertical scale). The black line shows the number of serious violent crimes per 1,000 persons age 12+ from the NCVS — this line estimates the rates of rapes and sexual assaults, robberies, and aggravated assaults that occurred to U.S. residents age 12 and over. Finally, the blue line shows the number of serious violent crimes per 1,000 population from the NCVS that were reported to the police, and the dotted blue lines show the 95% confidence limits for the crimes reported to police.

Figure 3. Rates of serious violent crime (rape, robbery, aggravated assault) from the NCVS (black and blue lines) and FBI statistics (red line). Data sources: NCVS dashboard and FBI Crime Data Explorer. The NCVS statistics from 2006 are omitted because of methodology differences for that year.
Although there are some differences in the crime definitions and populations for the NCVS and the FBI statistics,*** we would expect to see a general concordance between the NCVS rates of serious violent crimes reported to the police and the FBI statistics for violent crime. The red (FBI) line is, in fact, usually within the 95% confidence limits (dotted blue lines) for the NCVS statistics of violent crimes reported to the police between 2000 and 2019. Rosenfeld (2007) discussed possible reasons for the higher divergence between FBI and NCVS statistics before 2000; one hypothesis was that police crime reporting procedures improved with increasing computerization and greater sensitivity to violence against women.
In 2020, though, the FBI line continues its approximately flat trajectory, while the NCVS lines dip in 2020. The NCVS serious violent crime change from 2019 to 2020 is statistically significant at the 5% level. The calculations of statistical significance for the change are based on the sampling variability of the NCVS (the variability that arises from taking a sample of households instead of measuring everyone in the population). To conclude that there was a real decrease in serious violent crime in 2020, one must assume that sampling variability is the only factor affecting the year-to-year comparison, and that other errors from measurement (do people answer the survey questions “correctly”?) and nonresponse (some people selected to be in the sample end up not participating in the survey) would affect the NCVS statistics the same way for both years.
Were the effects of measurement and nonresponse errors the same for 2020 as for previous years? That depends on how the COVID-19 pandemic affected NCVS data collection procedures. The NCVS uses a rotating panel design to collect data, in which residents of a sampled address are interviewed every six months for a total of seven interviews; after the seven interviews, the address is removed from the sample and replaced with another address. Prior to the pandemic, the first interview with a household and its members was conducted face-to-face (in person)**** and the subsequent (second through seventh) interviews with household members were conducted primarily by telephone. A subsequent interview with a household member was conducted face-to-face if the respondent did not have a telephone, was difficult to reach by telephone, or preferred to be interviewed in person.
The Census Bureau, which collects the data for the NCVS, suspended face-to-face data collection for all surveys in March 2020. This meant that no data were collected from the households at the addresses scheduled for their first interview, and no data were collected from returning households in the sample who would normally have been interviewed in person. Face-to-face data collection resumed for returning sample households on July 1, 2020 in 21 states. In October, 2020, face-to-face data collection (with modified procedures) resumed for all incoming and returning sample households.
The NCVS uses face-to-face interviewing in normal operations because some households are difficult or impossible to reach by telephone; the face-to-face data collection gives a higher response rate and better representation of the United States. In an analysis of NCVS data from 2009 to 2013, the Bureau of Justice Statistics found that the estimated serious violent crime victimization rate calculated from persons interviewed face-to-face was approximately twice the rate calculated from persons interviewed by telephone. This difference “may be due to the interviewing conditions or the composition of respondents” interviewed by telephone or face-to-face. Thus, it would be expected that just using the usual weighting procedures, without attempting to adjust for the absence of face-to-face interviews during the middle of 2020, would underestimate the level of violent crime.
Extra Weighting Adjustments for the 2020 NCVS
The statisticians who compute the NCVS estimates modified the usual weighting procedures (described in my book Measuring Crime: Behind the Statistics) to attempt to adjust for the decrease in sample size and the shortage of in-person interviews.
Statisticians estimate the number of people in the population having a particular characteristic by summing the weights of the survey respondents having that characteristic. For example, the sum of the weights of respondents who experienced at least one violent crime estimates the number of U.S. persons age 12+ who experienced at least one violent crime. The statisticians who work on the NCVS data always calibrate the weights so that they give the correct count for characteristics that are known for the population from other sources — for example the NCVS weights are calibrated so that they give the “right” estimates for the number of people in different age/race/gender groups.
For a rough idea of how weighting adjustments work, suppose that only half of young males who are selected to be in the survey actually participate. The weight of each young male in the sample is multiplied by 2 so that he represents one young-male nonrespondent’s share of the population as well as his own. Essentially, it’s assumed that on average, the young males who provide data in the survey have the same victimization rates as the young males who are selected for the sample but do not provide data. If that assumption is even approximately valid, using the adjusted weights should improve the accuracy of the estimated number of victimizations.
In 2020, the pandemic lowered the response rates of sampled persons who, in a normal year, would have been interviewed face-to-face (and who, according to previous research, would typically report more victimizations to the survey). To attempt to compensate for this extra nonresponse, the NCVS statisticians added three steps (described in the “Source and Accuracy Statement” of U.S. Bureau of Justice Statistics, 2021a) to the usual weighting procedures. These steps had similar goals as the usual weighting procedures: to assign nonrespondents’ weights to respondents who are thought to be similar to them, and to have the final weights give the correct counts for characteristics known for the population.
Households at addresses that would have entered the sample between April and September 2020 were not interviewed because the face-to-face data collection was suspended. Previous research had shown that persons new to the sample (and those interviewed face-to-face) typically have higher victimization rates than other persons, so the base weights of the addresses that would have entered the sample between April and September were transferred to the households who entered the sample (and interviewed face-to-face) during the other months of 2020.
The pandemic may have also caused replacement households to be underrepresented in the sample. These are households that move in to an NCVS-sample address midway through the series of seven interviews (replacing a household that moved away). Replacement households typically have higher victimization rates than non-replacement households (this may be associated with their higher mobility). The weights for households of different types (households at addresses entering the sample for the first time; households that had previously participated in at least one NCVS interview, and replacement and new-growth households) were adjusted so that the percentage in each group for 2020 agreed with the 2019 percentages.
Many colleges switched to remote learning during 2020, and college students who had been living in dormitories moved elsewhere. Other types of group quarters such as nursing homes also had population changes during the pandemic. The weights for some types of group quarters were calibrated to match 2019 percentages.
These additional weighting adjustments attempted to compensate for households and persons that were missing from the data because face-to-face interviewing was suspended for part of 2020. U.S. Bureau of Justice Statistics (2021a) describes some analyses that were performed to investigate possible bias that might remain after the weighting adjustments. The main analysis developed a model predicting victimization status from variables known for nonrespondents as well as respondents, and the investigators concluded that there were no significant differences in these predicted rates between the full sample and the respondents alone. But the authors are careful to remind the reader that “these estimates are calculated from predictions of personal crime victimization for both respondents and nonrespondents, and may not match actual response data.”
The U.S. Bureau of Justice Statistics (2021a) also found that estimated victimization rates decreased from 2019 to 2020 in each of the types of households treated in the second weight adjustment, and that analysis, along with the comparison of predicted victimizations for respondents and nonrespondents, leads them to “to believe this is a true change in victimizations rather than an impact of the data collection changes in the NCVS.”
It is possible, however, that the pandemic may have also affected how people in all types of households answered questions in the survey. Starting in March 2020, large numbers of people were staying home. One might expect a decrease in the number of people experiencing assaults by strangers after March 2020, but perhaps an increase in the number experiencing assaults by persons in the same household.
The 2020 NCVS exhibits a slight (not statistically significant) decrease in stranger assaults for 2020. The estimated 2020 rates of intimate partner violence (serious violent crimes or simple assaults committed by current or former spouses, boyfriends, and girlfriends) and domestic violence (serious violent crimes or simple assaults committed by intimate partners or other family members) were significantly lower than the corresponding rates in 2017, 2018, and 2019.
Measurement Errors
Shannan Catalano studied effects of interviewing conditions on NCVS victimization rates. Her research showed that persons interviewed face-to-face reported more victimizations on average than those interviewed by telephone, as mentioned above. She also studied differences in reported victimizations between two groups of face-to-face interviewees who lived in multiperson households: those interviewed alone, and those interviewed with others in the room. Persons interviewed alone reported about 1.4 times as many serious violent victimizations, on average, as those interviewed in the presence of others. Catalano suggested that part of this discrepancy could be due to different household compositions. It might also be due to a reluctance from crime victims to discuss certain victimizations in front of another person. A child, for example, might not want his parent to know he had been assaulted at school. In some cases the other person in the room might be the perpetrator of the violence.
In 2020, about 60% of the interviews conducted face-to-face with children age 12-17, and about 40% of the face-to-face interviews with adults, were conducted in the presence of another person. But the majority of interviews in 2020 were conducted by telephone, where it was not possible to know whether someone else was listening to the interview. More research is needed to study the effects of this type of measurement error on the 2020 violent crime victimization rates. It is also possible that the constant presence of other persons in the household affected the likelihood that a crime victim would participate in the interview at all.
Other data sources containing information on assaults were also affected by the pandemic. The 2020 Child Maltreatment Report by the U.S. Department of Health and Human Services, which compiles data collected from state child welfare agencies, reported decreased numbers of children who received a child protective services investigation response in 2020 when compared with 2019, and also reported decreased numbers of children found by those investigations to have been victims of abuse. But the decline was much larger in children age 6-17 than in children under age 6. With many schools closed in 2020, there was a huge dropoff of reports initiated by education personnel, from about 145,000 reports in April-June 2019 to about 60,000 reports in April-June 2020. It seems likely that the decrease in agency-investigated maltreatment for school-age children is related to the decreased reporting by schools.
Although Figure 3 shows a small, but statistically significant, decrease in violent crime for 2020 from the NCVS, the 2020 crime estimates could have been affected by NCVS procedures, response rates among crime victims and non-victims, or measurement issues that differed between 2019 and 2020. The extra weighting steps applied to the 2020 data attempted to compensate for the sudden switch to all-telephone interviewing and the shortage of new addresses in the survey, but it is possible that these steps did not account for all the differences in data collection between 2019 and 2020. The U.S. Bureau of Justice Statistics (2021a) gives the advice: “Since the full extent of the nonsampling error is unknown, one should be particularly careful when interpreting results based on small differences between estimates.” This is particularly good advice for interpreting the small difference between the violent crime rates in 2019 and 2020.
2021 Crime Statistics
Crime statistics for 2021, which will be reported in fall of 2022, may also provide information that will help with the interpretation of the 2020 crime statistics. The NCVS data collection for 2021 has returned to near-normal procedures, so the 2021 statistics will not need all of the special adjustments that were used for the 2020 statistics. But the 2021 FBI statistics are scheduled to be based entirely on the NIBRS system, since the SRS was retired in 2020. The quarterly UCR report made available on December 15, 2021 was based on data received from 9,101 of the 18,794 U.S. law enforcement agencies. The tables give the crime statistics reported by agencies serving areas with population greater than 100,000. The cities with missing data include New York City, Los Angeles, and Phoenix: three of the five largest cities in the United States. The FBI plans to use weighting to deal with missing data for producing the 2021 crime statistics, but I have not yet seen a technical report detailing the methodology.
Some Suggestions for Reporting Crime Statistics
Emphasize the crime rates or numbers, not the percentage change. Remember, a city that had 1 homicide in 2019 and 2 homicides in 2020 has seen homicide go up by 100%.
A November 2021 article in the New York Times gave a particularly confusing take on crime statistics. The article did not display or list statistics for violent crimes other than homicide, but displayed a graph of “Annual Percent Change in Violent Crime and Homicide Rates.” This graph gave the misleading impression that homicide and violent crime in general were both skyrocketing to unheard-of levels. The graph was also not well explained, and some readers may have thought that it displayed crime rates, not year-to-year percentage changes. A much better graph would have shown the crime rates; any reader can tell whether the graph goes up or down over time.
Pay attention to the scale of the graphs. Figure 2, taken from the Crime Data Explorer, can give the impression that there were large changes in police-reported violent crimes over the last decade, but the actual numbers were close to 400 violent crimes per 100,000 persons each year, with little variation from year to year.
Display the statistics over multiple years so readers can see the trends. In Figure 3, I displayed data from 1993 (the first year the NCVS used the current survey instrument) to 2020. The longer time period shows the relative flatness of violent crime rates in the 2010s relative to the higher crime rates in the 1990s.
Emphasize that crime statistics are not exact numbers, but estimates that are affected by sample sizes, measurement error, and missing data. Describe possible sources of error alongside the presentation of the statistics.
Footnotes
*The title of this column is adapted from Love in the Time of Cholera by Gabriel García Márquez. That book, however, might have been equally well titled “Crimes in the Time of Cholera” — I counted far more crimes than acts of genuine love in the book, including 6 homicides, 2 aggravated assaults, 4 sexual assaults, and multiple instances of fraud and prostitution. And this list includes only the crimes that are described with names and details. Many other crimes, such as the massacre of the banana workers, the knife assaults on women, and the rapes of novices, are mentioned only in passing. The protagonist Florentino Ariza is a stalker and even the book’s unreliable narrator credits him with multiple sexual assaults; undoubtedly, some of the other 622 long-term liaisons recorded in his diary, and many of the “countless fleeting adventures that did not even deserve a charitable note,” were rapes.
Measuring crime is challenging even in works of fiction.
**See my book Measuring Crime: Behind the Statistics for an in-depth discussion of the statistical issues affecting the interpretation of data from the FBI and from crime surveys.
The FBI weights the SRS data to account for law enforcement agencies that do not submit data.
The NIBRS statistics on the Crime Data Explorer, by contrast, are not weighted. They represent only the agencies that submit data to NIBRS and should not be used to draw conclusions about the United States as a whole, or about states in which only some agencies participate in NIBRS. For example, the SRS data record 808 homicides for New York State in 2020; the NIBRS data record 22 homicides for the state. The difference occurs because only 101 law enforcement agencies, representing about 15 percent of New York’s population (and not including New York City and other large cities in the state), reported NIBRS data in 2020.
***The FBI statistics include violent crimes committed against children under age 12, persons experiencing homelessness, persons in institutions, and non-U.S. residents; these populations are excluded from the NCVS.
****The NCVS follows addresses over time, not households. If the people living at an address move, and a new household takes up residence at that address, the new household is interviewed for the remainder of the set of seven interviews. Typically, the first interview with the new, replacement, household is conducted in person.
References
Thomas Abt (2022, January 27). What’s behind rising violent crimes in the U.S., and how they can be reduced. Interview with Amna Nawaz on PBS. Note that, despite the title of the article, reporter Nawaz does not present evidence of rising violent crime in general; she mentions a few recent incidents at the beginning and then cites homicide statistics (which increased from 2019 to 2020). As we’ve seen in this column, however, there is no evidence from the FBI or NCVS statistics that violent crime in general increased.
Jeff Asher (2021). Murder rose by almost 30% in 2020. It’s rising at a slower rate in 2021. The New York Times, September 23, p. A20.
Jeff Asher and Rob Arthur (2022). The data are pointing to one major driver of America’s murder spike. The Atlantic.
David Brillinger (1986). The natural variability of vital rates and associated statistics. Biometrics, 42, 693-734.
John Gramlich (2021). What we know about the increase in U.S. murders in 2020. Pew Research.
Jenny K. Leigh, Lita Danielle Peña, Ashri Anurudran, and Anant Pai (2022). “Are you safe to talk?”: Perspectives of service providers on experiences of domestic violence during the COVID-19 pandemic. Journal of Family Violence, 1-11.
Gabriel García Márquez (1988). Love in the Time of Cholera. Translated by Edith Grossman. New York: Alfred A. Knopf.
Rachel E. Morgan and Alexandra Thompson (2021). Criminal Victimization, 2020. Washington DC: U.S. Bureau of Justice Statistics.
Richard Rosenfeld (2007). Explaining the divergence between UCR and NCVS aggravated assault trends. In J. Lynch and L. Addington (eds), Understanding Crime Statistics: Revisiting the Divergence of the NCVS and UCR. New York: Cambridge University Press, 251-268.
Richard Rosenfeld and Ernesto Lopez (2021). Pandemic, Social Unrest, and Crime in U.S. Cities: March 2021 Update. Washington, DC: Council on Criminal Justice.
U.S. Bureau of Justice Statistics (2021a). National Crime Victimization Survey, 2020, Codebook and Public Use Data. Study 38090. Ann Arbor, MI: Inter-university Consortium for Political and Social Research.
U.S. Bureau of Justice Statistics (2021b). The National Crime Victimization Survey and Uniform Crime Reporting Program: A Complementary Picture of Crime in 2020. Washington DC: U.S. Bureau of Justice Statistics.
Copyright (c) 2022 Sharon L. Lohr