Up, Down, or Sideways? Looking at the 2021 Crime Statistics
The 2021 statistics for the Uniform Crime Reports and the National Crime Victimization Survey have now been published, along with some preliminary estimates of homicide from the Centers for Disease Control and Prevention. Let’s take a look at the violent crime numbers and talk about how to interpret them.*
For those who don’t want to wait for the conclusion, here’s the bottom line: the best evidence available right now indicates that crime rates overall in 2021 were about the same as in 2020. But many people believe otherwise — without any data backing them up.
NATIONAL CRIME VICTIMIZATION SURVEY
First, let’s look at the results from the National Crime Victimization Survey. This is an annual survey that asks people ages 12 and higher living in U.S. households about criminal victimizations that happened to them — whether the police learn about those crimes or not. Figure 1 reproduces the graph from Thompson and Tapp (2022) on violent victimization rates from 1993 through 2021.
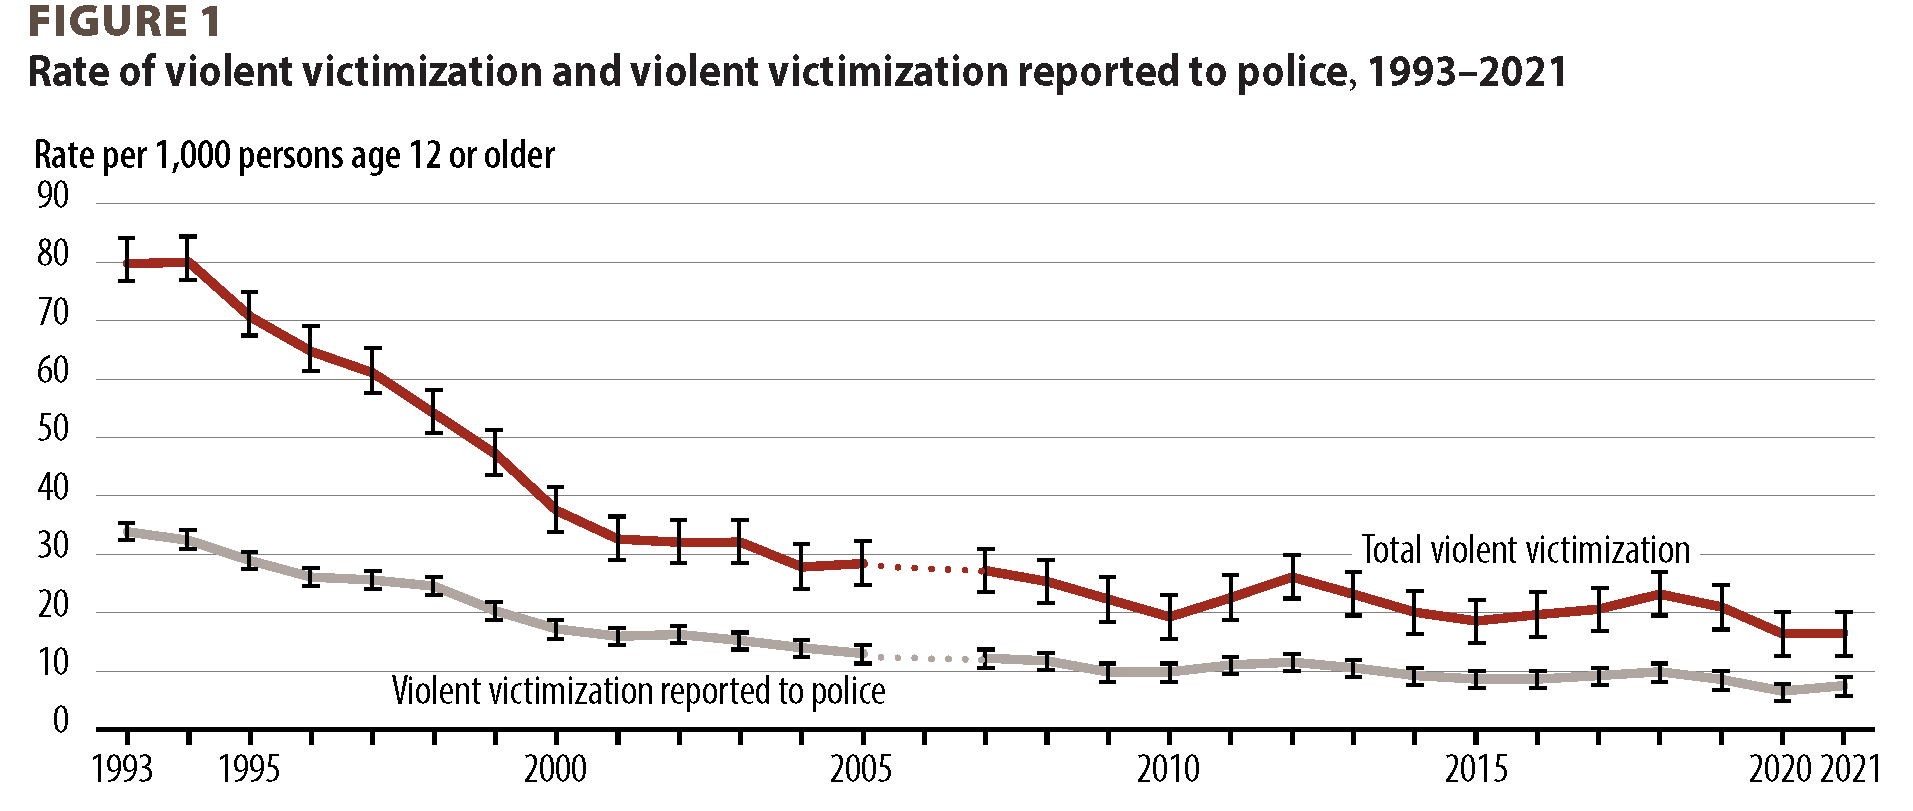
Source: Thompson and Tapp (2022). The vertical lines are 95 percent confidence intervals for the estimates.
As you can see from the graph, there was little change in the overall rate of violent victimizations between 2020 and 2021, and the rates in both years are among the lowest in the post-1993 period. The National Crime Victimization Survey gives the highest-quality evidence we have about changes in violent crime and property crime against households from 2020 to 2021.** From this survey, there are no significant differences in any type of violent or property crime between 2020 and 2021, indicating that national crime rates remained largely unchanged.
Figure 1 shows that although violent crime rates were approximately the same in 2020 and 2021, the percentage of violent crimes that were reported to the police increased. Thompson and Tapp (2022) estimated that in 2020, 40.2 percent of violent crimes across the United States were reported to police and this increased to 45.6 percent in 2021. This statistically significant increase in percentage of crimes reported to the police was driven largely by an increase in the percentage of simple (non-aggravated) assaults that were reported to the police. An estimated 49.3 and 52.2 percent of “serious” violent crimes (rape, robbery, aggravated assault) were reported to police to 2020 and 2021, respectively (the difference is not statistically significant).
It is important to keep percentages of crimes reported to police in mind when interpreting crime statistics originating from police departments, because what looks like an increase in crime may actually be an increase in reporting. For example, suppose an area had 100,000 violent crimes in both 2020 and 2021. In 2020, 40,200 of these crimes were reported to the police but 45,600 of the 100,000 crimes that occurred in 2021 were reported to police. If one looked at the police statistics without knowing about the changes in percentages reporting to the police, one might conclude that crime increased by nearly 14 percent — when in fact crime was unchanged.
HOMICIDE
The National Crime Victimization Survey asks people about crimes that happened to them, and thus cannot measure homicide. Preliminary data on homicides are available for 2021 from the Centers for Disease Control and Prevention’s National Vital Statistics System, which tracks all deaths in the United States. Simon et al. (2022) reported that there were 24,584 homicides in 2020 and 25,987 homicides in 2021, an increase of 5.4 percent. All of the increase was from homicides committed with firearms — in fact, the number of homicides committed with other weapons decreased between 2020 and 2021. The firearm homicide rate was 8.9 percent higher in 2021 than in 2020, and in 2021 a record-high 80.7 percent of homicides (20,966) were committed with firearms.
The trends in homicide are similar to those for violent crime in general. Figure 2 shows a big decrease from the early 1990s through about 2014. Since, then, however, homicide rates have risen. In each of 2015 and 2016, the homicide rate increased by about 10 percent. The big jump in homicide, however, was between 2019 and 2020, when the homicide rate rose by 33 percent — the largest one-year increase in more than a century. That level persisted into 2021, but the increase in 2021 was small.

Figure 2. Homicide rates from 1980 to 2021. Source: annual National Vital Statistics Reports on Deaths: Final Data for [year] and Simon et al. (2022). The spike in 2001 was due to the deaths caused by the 9/11 attacks.
UNIFORM CRIME REPORTS
In my other posts about annual crime statistics (see, for example, posts in 2020 and 2018), I have contrasted the violent crime statistics from the National Crime Victimization Survey with those from the Uniform Crime Reports, the FBI’s compilation of crimes reported to law enforcement agencies across the country. The Uniform Crime Reports have been a primary source of information about crime since they started in 1930. But in 2021, the FBI changed the system used to collect data from police departments. From 1930 to 2020, law enforcement agencies submitted monthly counts of crimes occurring in their jurisdictions. On January 1, 2021, the FBI switched over to a new system that collects details about incidents (the National Incident-Based Reporting System, abbreviated NIBRS and pronounced nigh-bers) and stopped accepting data in summary count form.
Because of this switch, and the accompanying changes in crime definitions and how offenses are counted, FBI crime statistics from 2021 (under the new system) are not directly comparable with the statistics from 2020 (under the old system). In addition, far fewer law enforcement agencies submitted data in 2021 than in 2020. Due to the large amount of missing data, the FBI (2022) estimated crime rates for 2021 and changes in rates from 2020 to 2021 using statistical models.*** Morgan and Smith (2022) concluded that the national rates for violent and property crime in 2021 were not significantly different from the corresponding rates in 2020 (both calculated from NIBRS data). But the estimates (FBI, 2022) have a high level of statistical uncertainty because of the large amount of missing data — so much uncertainty, in fact, that there would have to be a huge change in crime from 2020 to 2021 to be able to declare the difference statistically significant. Asher (2022) commented that one cannot tell from the published NIBRS statistics whether crime in 2021 increased or decreased from the 2020 levels. For 2021, therefore, the most accurate source of information on the level of nonfatal violent crime is the National Crime Victimization Survey.
INTERPRETING 2021 CRIME STATISTICS
Figure 1 shows that, in general, violent crime rates decreased dramatically from the early 1990s to about 2010, and have more or less remained constant (with a few minor ups and downs) since then. Homicide rates had a similar trend through 2014 but then began increasing, with a big jump in homicides from 2019 to 2020 (Figure 2). These are national trends, and different communities have different trajectories over time (see here for state-by-state homicide rates). But it’s clear that for the nation as a whole, violent crime (except for homicide) has mostly decreased or held steady. And there are preliminary indications that the homicide rate may be dropping in 2022. The Council on Criminal Justice, monitoring crime in 29 cities, found that homicides in the first half of 2022 are lower than in the first half of 2021.
Since 1972, the Gallup poll has asked: “Is there more crime in the U.S. than there was a year ago, or less?” In the 2022 poll, an overwhelming 78 percent of people said there was more crime now than a year ago. But the 2022 Gallup poll number is not an anomaly — every year since 2005, more than 60 percent of people have said crime was increasing, even though it was dropping or decreasing throughout that time period, as shown in Figure 1. The next time someone tells you crime is increasing, ask them to provide their evidence.
Footnotes
*My book Measuring Crime: Behind the Statistics gives the background on the data sources discussed in this post.
**What are factors that might affect these survey numbers? Well, 2020 was a difficult year for many government surveys because the COVID-19 pandemic forced a temporary shutdown of in-person interviewing. Survey operations were restored by the end of that year but response rates for 2020 were lower than in previous years — 67 percent of the households in the sample participated in the survey — and that response rate persisted into 2021. The survey staff perform weighting adjustments to attempt to compensate for the nonresponse but it is possible that some bias remains after these adjustments are made.
The nonresponse weighting adjustments are described in my book Measuring Crime: Behind the Statistics. See https://www.sharonlohr.com/blog/2022/01/21/crime-statistics-covid-19 for the additional weighting adjustments used in 2020. Note that although the overall response rate is the same for 2020 as for 2021, the types of nonresponse differed. In 2020, about 9 percent of households didn’t participate because of pandemic-related effects on survey operations and 20 percent refused to participate. In 2021, the survey operations returned to normal but the refusal rate increased to 25 percent (Scalyer and Toribio, 2022).
If there is nonresponse bias remaining after the weighting, however, it likely has less effect on estimates of year-to-year changes in crime than on the amount of crime in 2020 or 2021. If, for example, people who refuse to participate in the survey are less likely to be crime victims, then those people are missing from both 2020 and 2021 and their effects largely cancel out.
***In 2020, the FBI received data from law enforcement agencies serving areas that included more than 95 percent of the U.S. population. In 2021, the agencies submitting data served areas that included only about 65 percent of the U.S. population, and thus the data for about 35 percent of the population had to be estimated. Berzofsky et al. (2022) described the types of statistical methods that were used to produce the estimates, but I have not yet seen a full methodology report for the 2021 NIBRS estimates with sufficient technical details to allow an independent researcher to reproduce the estimates from the publicly available NIBRS data (see my guidelines for judging the quality of a statistic in Chapter 7 of Measuring Crime: Behind the Statistics).
REFERENCES
Asher, J. (2022). The FBI’s murder rate mystery: Good luck figuring out what happened with crime in 2021. https://www.vox.com/policy-and-politics/2022/10/6/23389507/murder-crime-rate-fbi-report
Berzofsky, M., Liao, D., Couzens, G.L., Smith, E.L., and Barnett-Ryan, C. (2022). Estimation Procedures for Crimes in the United States Based on NIBRS Data. Report NCJ-305108. Washington, DC: Bureau of Justice Statistics and Federal Bureau of Investigation.
Federal Bureau of Investigation (FBI, 2022). The Transition to the National Incident-Based Reporting System (NIBRS): A Comparison of 2020 and 2021 NIBRS Estimates. Washington, DC: FBI.
Lohr, S. (2019). Measuring Crime: Behind the Statistics. Boca Raton, FL: CRC Press.
Morgan, R.E. and Smith. E. (2022). The National Crime Victimization Survey and National Incident-Based Reporting System: A complementary picture of crime in 2021. Report NCJ 305180. Washington, DC: Bureau of Justice Statistics.
Simon, T. R., Kegler, S. R., Zwald, M. L., Chen, M. S., Mercy, J. A., Jones, C. M., Mercado-Crespo, M. C., Blair, J. M., and Stone, D. M. (2022). Increases in firearm homicide and suicide rates - United States, 2020-2021. Morbidity and Mortality Weekly Report, 71(40), 1286-1287.
Scalyer, Z. and Toribio, N. (2022). Source and accuracy statement for the 2021 National Crime Victimization Survey. In Bureau of Justice Statistics, National Crime Victimization Survey [United States] 2021 Codebook. Ann Arbor, MI: Inter-university Consortium for Political and Social Research.
Thompson, A. and Tapp, S.N. (2022). Criminal Victimization, 2021. Report NCJ 305101. Washington, DC: Bureau of Justice Statistics. https://bjs.ojp.gov/library/publications/criminal-victimization-2021
Copyright (c) 2022 Sharon L. Lohr