Interpreting the 2024 National Violent Crime Statistics
The Federal Bureau of Investigation (FBI) and Bureau of Justice Statistics (BJS) released their 2024 crime statistics in September. Let’s take a look at crime trends, and then discuss some of the changes that may have affected the statistics in 2024. Data sources are listed at the end of this post; see Lohr (2019) for detailed descriptions of crime datasets.
Homicide
There are two national sources of information about homicides, and Figure 1 shows that the homicide rate decreased from 2023 to 2024 in both. After a surge during the COVID pandemic, homicide rates have reverted to pre-2017 levels.
The upper line in Figure 1 is number of homicides per 100,000 population from the CDC’s National Vital Statistics System. These statistics are calculated from information in death certificates, where deaths resulting from assault are classified as homicides. The lower line in Figure 1 is the homicide rate from the FBI Crime Data Explorer, calculated from data submitted by law enforcement agencies; for 2024, 16,675 law enforcement agencies covering 95.6 percent of the US population submitted data, and the FBI used weighting techniques to estimate crimes occurring in the non-covered part of the population (see Data Sources section).
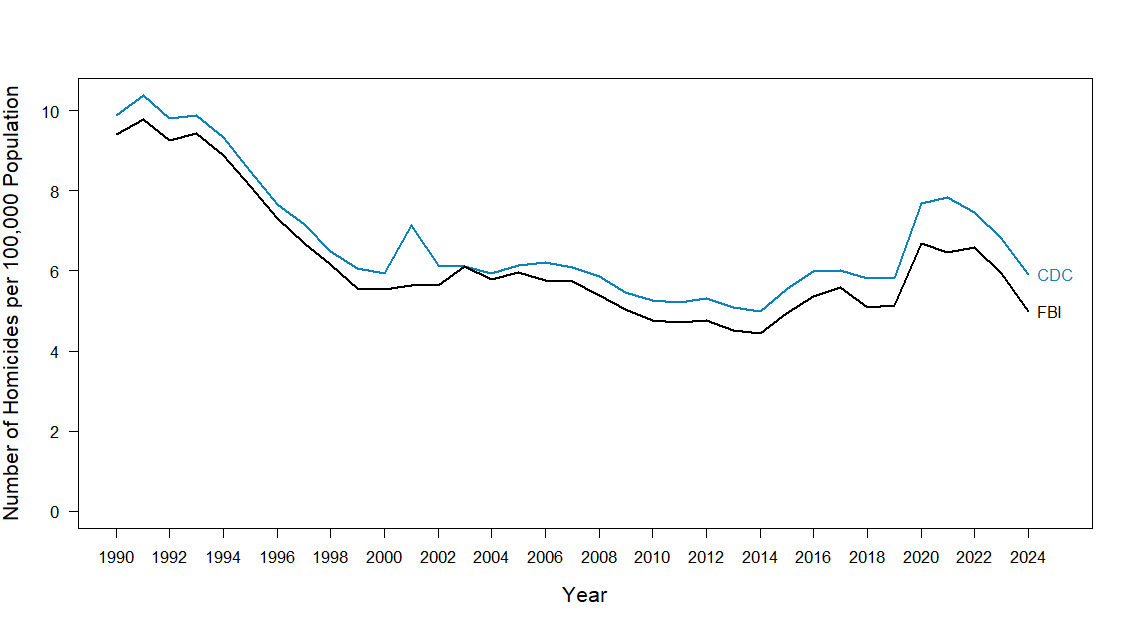
Figure 1. Homicide rates from the CDC and FBI, 1990-2024. See the Data Sources section for comments on how these statistics are calculated.
The CDC and FBI homicide rates differ because they have different definitions of homicide and different sources of information. The CDC rate includes intentional and negligent homicides as well as deaths from terrorist attacks (responsible for the 2001 spike), while the FBI includes only intentional deaths from murder and non-negligent manslaughter. The homicide rate in both data collections, however, showed large decreases from 2023 to 2024: 15% for the FBI rate and 13.5% for the CDC rate. These are the largest one-year percentage decreases in homicide rates for the time span displayed in Figure 1.
Violent Crime Excluding Homicide
Figure 2 shows the estimated violent crime rates for rape, robbery, and aggravated assault as measured by the FBI and National Crime Victimization Survey between 1993 (the year the current NCVS questionnaire was adopted) and 2024. For most years between 2000 and 2019, the rate of rape, robbery, and aggravated assault from the FBI statistics has been close to the NCVS rate of serious violent crime reported to the police, even though there are differences in the crime definitions and the populations studied for the two sources. Since 2020, however, the two series have diverged somewhat, and let’s look at some potential reasons for that divergence.
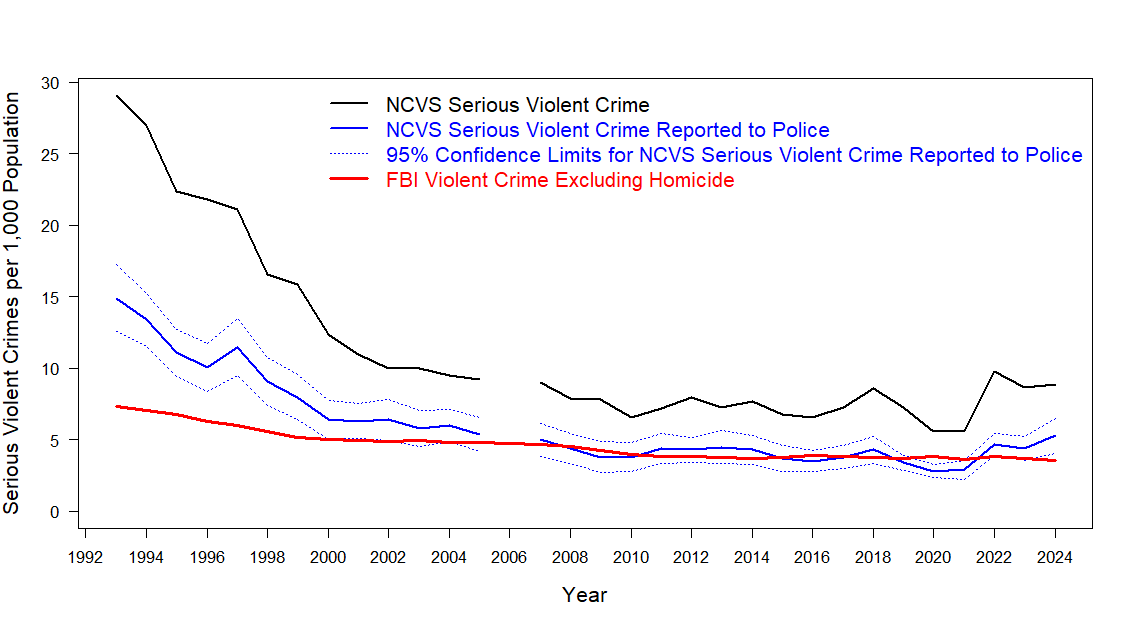
Figure 2. Violent crime rates for rape, robbery and aggravated assault (“serious violent crime”) as measured by the FBI and the NCVS. The NCVS statistics for 2006 are deemed unreliable (Tapp and Coen, 2024) and are not displayed. See the Data Sources section for comments on how these statistics are calculated and on changes to the NCVS in 2024.
The FBI statistics from Table 1 in “Crime in the United States” (see Data Sources section) provide information about rape, robbery, and aggravated assault from law enforcement agencies. These statistics include only crimes that are known to the police. Thus, a decrease in crime rates can occur because of a drop in the amount of crime, or it can occur because fewer crimes are reported to the police and end up in the official statistics.
The NCVS crime statistics calculated from a probability sample of US households. Persons aged 12 and older in the sampled households are asked about details of victimizations that happened to them (including whether each incident was reported to the police). The NCVS thus includes crimes that are not reported to the police as well as those that are reported to the police. However, the blue NCVS line in Figure 2 of crimes reported to the police shows a slight increase (although not statistically significant) from 2023 to 2024, while the FBI line shows a decrease of about 5 percent.
Some of that difference may be explained by the slightly different definitions of rape, robbery, and aggravated assaults used by the NCVS and the FBI. The NCVS definition of sexual assault, for example, is more expansive than that used by the FBI. In addition, the sets of persons whose crimes are counted differ in the two datasets. The NCVS does not measure victimizations of children under age 12, people in prison or nursing homes, people experiencing homelessness, or US nonresidents such as tourists. Crimes occurring to people in those groups are included in the FBI statistics.
The NCVS estimates have sampling and nonsampling error. The dotted lines in Figure 2, showing the 95% confidence intervals for crimes reported to the police, reflect the uncertainty that arises because the NCVS measures victimization on a sample instead of the entire population. Confidence intervals for all serious violent crimes (including those not reported to the police) are not shown on the graph to avoid clutter, but they are about 1.5 times the width of the intervals for serious violent crimes reported to the police. In 2024, the confidence intervals for NCVS statistics are wider than in previous years because the sample size was reduced (see Data Sources).
The NCVS confidence intervals do not include uncertainty from measurement error and nonresponse bias, however. In 2024, approximately 49 percent of persons selected to be in the sample provided answers to the survey (Tapp and Coen, 2025; Krueger and Schar, 2025). This is the lowest response rate the NCVS has ever had; in 1993, the NCVS person-level response rate was close to 90 percent (see Figure 3).
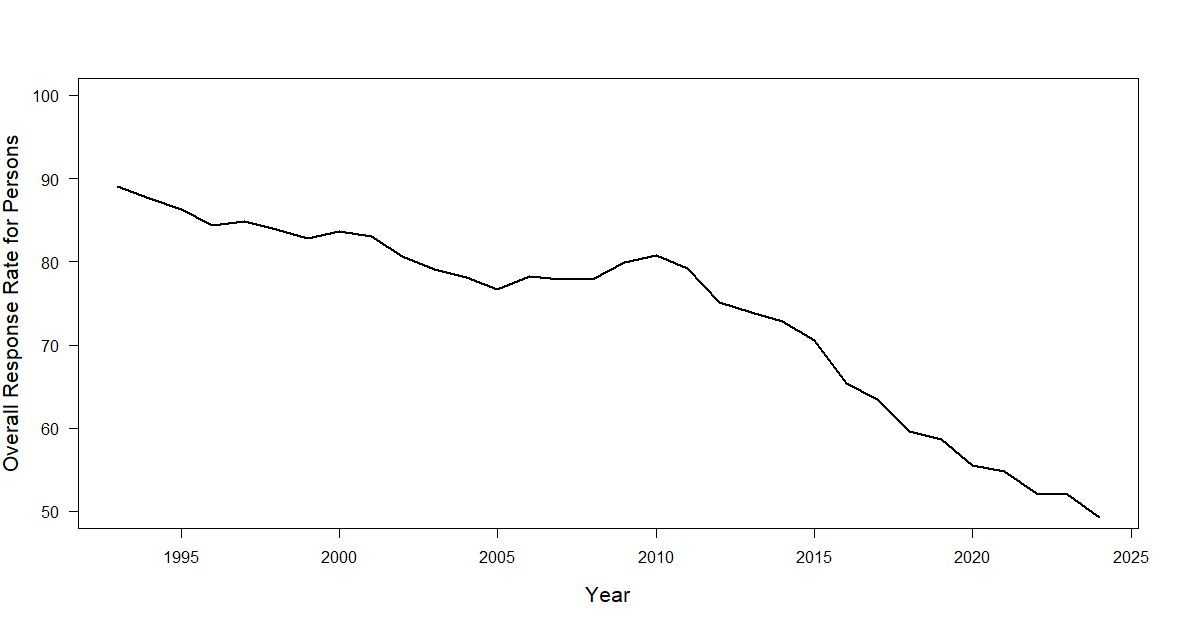
Figure 3. NCVS response rates for personal interviews, 1993-2024. In 2024, the overall response rate fell below 50 percent for the first time.
In 2024, response rates were lower for men than for women; for persons age 12-24 than for older persons; and for persons of Hispanic origin than for persons not of Hispanic origin. In a typical year, persons aged 18-24 have the highest victimization rates, so the low response rate (about 40 percent) in this age group is of particular concern.
The accuracy of NCVS statistics also depends on the accuracy of information that respondents provide to the interviewer. NCVS interviewers ask for a description of each incident to better classify the type of crime, but they will have no information on crimes that the respondent does not disclose (for example, a domestic violence victim might not tell the interviewer about those crimes).
Violent Crime 2024
The FBI and CDC statistics both indicate that homicide rates decreased about 14-15 percent from 2023 and 2024 — this is the largest one-year percentage decrease in homicide in the data I have, which goes back to 1960. Homicide statistics are often considered to be the most accurate of all crime statistics because nearly all homicides are known to law enforcement agencies. The decrease in non-homicide violent crime between 2023 and 2024 is smaller; about 5 percent from the FBI statistics. The NCVS serious violent crime rate was not statistically significantly different from 2023 to 2024, but the small sample size and low response rate make it difficult to reach conclusions about crime trends from the survey.
Copyright (c) 2025 Sharon L. Lohr
References
Krueger, F. and Schar, B. (2025). Source and accuracy statement for the 2024 National Crime Victimization Survey. In National Crime Victimization Survey 2024 User Guide. Ann Arbor, MI: Inter-University Consortium for Political and Social Research.
Lohr, S.L. (2019). Measuring Crime: Behind the Statistics. Boca Raton, FL: CRC Press.
Tapp, S. N. and Coen, E. J. (2025). Criminal Victimization, 2024. NCJ Report 310547. Washington, DC: Bureau of Justice Statistics.
Data Sources
The CDC homicide rates for years through 2023 came from https://wisqars.cdc.gov/; the provisional rate for 2024 were obtained from https://www.cdc.gov/nchs/nvss/vsrr/mortality-dashboard.htm. The 2024 provisional rate may change slightly as more data accrue, but typically it is close to the final rate.
I downloaded Uniform Crime Reports (UCR) data from the FBI Crime Data Explorer on August 18, 2025. To download the tables of national estimates from the UCR, go to the main webpage of the Crime Data Explorer, then click on “Documents & Downloads.” Scroll down to the section “Crime in the United States Annual Reports” and download the CIUS Estimations data zip file. Table 1 contains the crime statistics from 2005 to 2024. Note that the FBI updates statistics as more data come in, so graphs in this post may differ from my previous writings. For example, the 2023 CIUS Estimations file listed 1,218,467 violent crimes (including homicide) and 19,252 homicides for 2023; the 2024 file updates the 2023 statistics to 1,278,301 and 19,907, respectively.
For 2024, Table 1 lists 1,211,345 violent crimes (including homicide) and 16,935 homicides, giving rates of 359.1 violent crimes and 5.0 homicides per 100,000 population. Descriptions of how the FBI statistics are calculated are given in “UCR Summary of Reported Crimes in the Nation, 2024” and “How These Numbers are Calculated” found in the Crime Data Explorer. Statistics that are provided through the National Incident-Based Reporting System (NIBRS) are converted to the older Summary Reporting System format, and then the estimated crime totals are weighted using essentially the same procedure that has been in place since 1958. See my post on the 2023 crime statistics for more information on how the estimates are calculated, and on other statistics available from the Crime Data Explorer.
NCVS statistics in FIgure 2 are from the annual publications Criminal Victimization. Tapp and Coen (2025) is the latest entry in this series. They can also be obtained from the N-DASH tool at https://ncvs.bjs.ojp.gov/Home.
The sample size used for the 2024 NCVS estimates was smaller than in previous years. The NCVS questionnaire used for the estimates in Figure 2 was last revised in 1992, and many societal structures and types of crime have changed since then. The questionnaire, for example, asks the respondent about thefts of car stereos, VCRs, and compact discs — not prime targets for thieves in 2024. To make the questionnaire more relatable to contemporary respondents and to incorporate results of research on how to better measure sexual assault and other crimes, BJS has developed and tested a new NCVS questionnaire. Switching to the new questionnaire all at once, however, would not allow researchers to look at year-to-year changes in crime because the old and new questionnaires measure victimizations differently.
To allow estimation of the 2023-to-2024 change in crime, BJS split the NCVS sample for 2024 into two parts: half of the sample was administered the 1992-based questionnaire, and the other half was administered the new questionnaire. The half of the sample given the 1992 questionnaire was used to estimate the statistics in Figure 2; the other half of the sample will be used to estimate crime changes from 2024 to 2025 (when the entire sample answers the new questionnaire). Because the sample size for 2024 estimates (109,341) was approximately half that used for the 2023 estimates (226,480 persons), the confidence limits for 2024 are wider than those for 2023.
We expect a sudden change in NCVS victimization rates when the 2025 statistics are released because the new questionnaire measures crime differently. Changes in victimization rates from 2024 to 2025 will be measured using the half of the 2024 sample that received the new questionnaire, but we will not be able to directly compare 2025 victimization rates with those from 1993 to 2023; one possibility would be to use the 2024 split sample to construct a model predicting new-questionnaire victimization rates from old-questionnaire victimization rates but such comparisons will depend on the accuracy of the model.
The 2020 and 2021 statistics from the NCVS were affected by data collection disruptions due to the pandemic (see my posts on 2020, 2021, and 2023 crime statistics).